Platform
From grazing to fire prevention, habitat analysis and decision-making
See which plots each flock keeps grazed, cross-referenced with the burnt-area history. GPS tracks over natural habitats and land use, to see where and how much the flock grazes. Reports, alerts and an agent that answers with your flocks' data.
Analysed layers
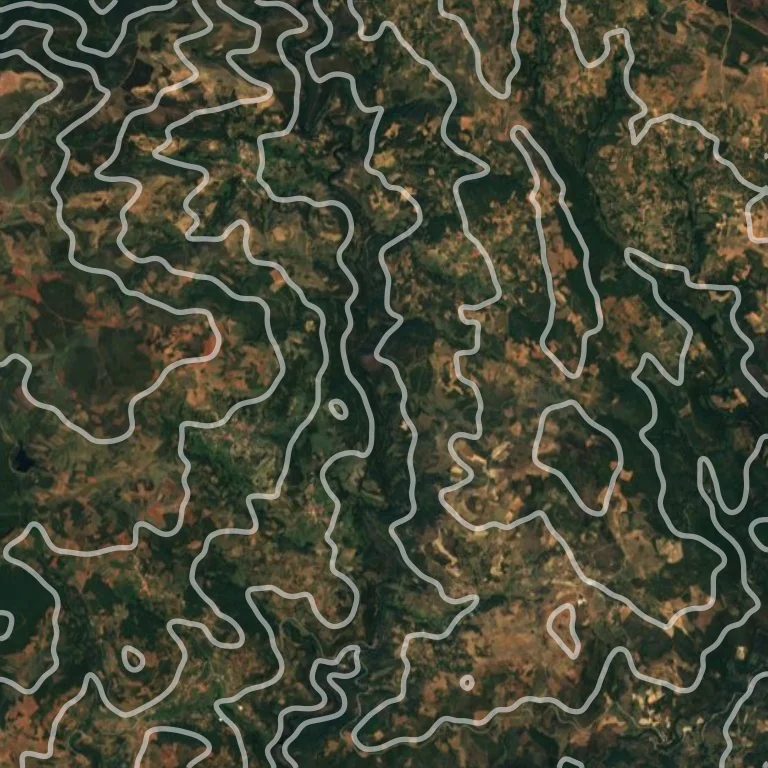
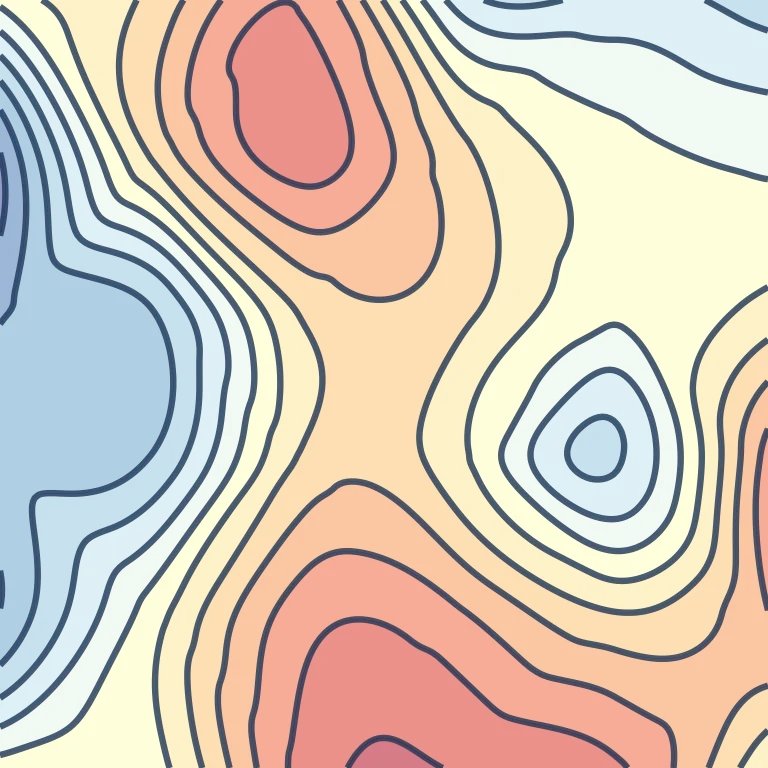
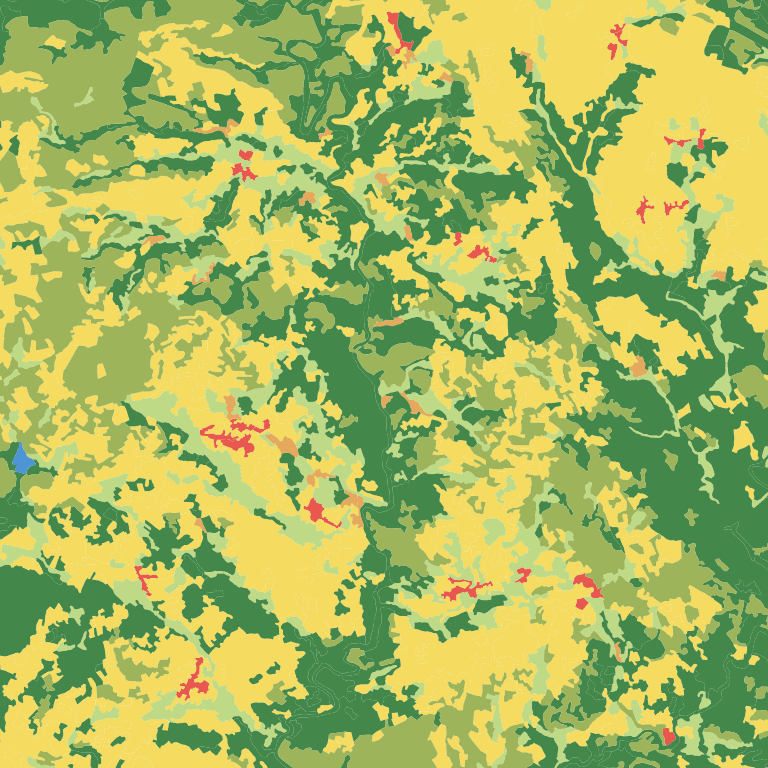
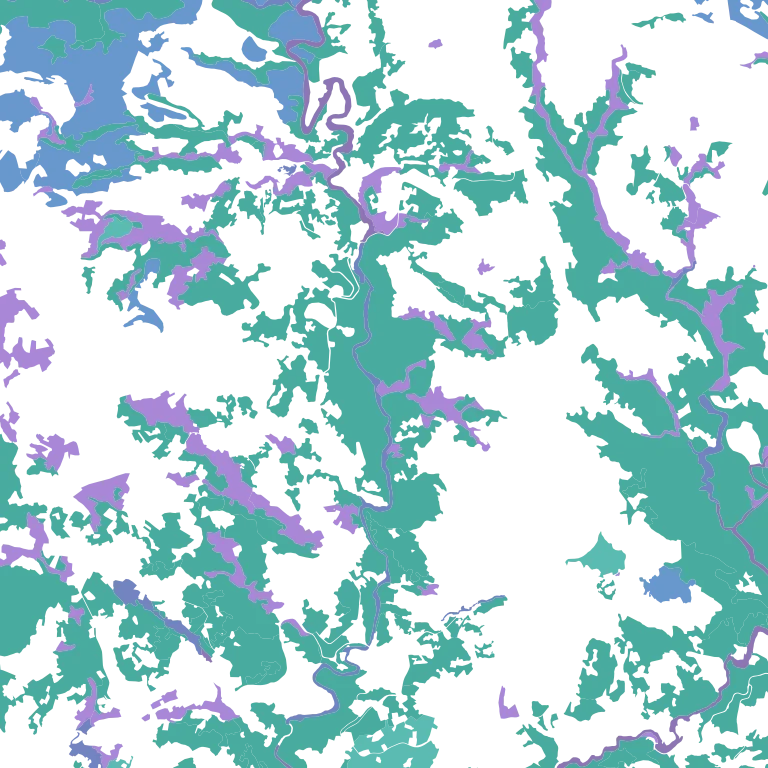
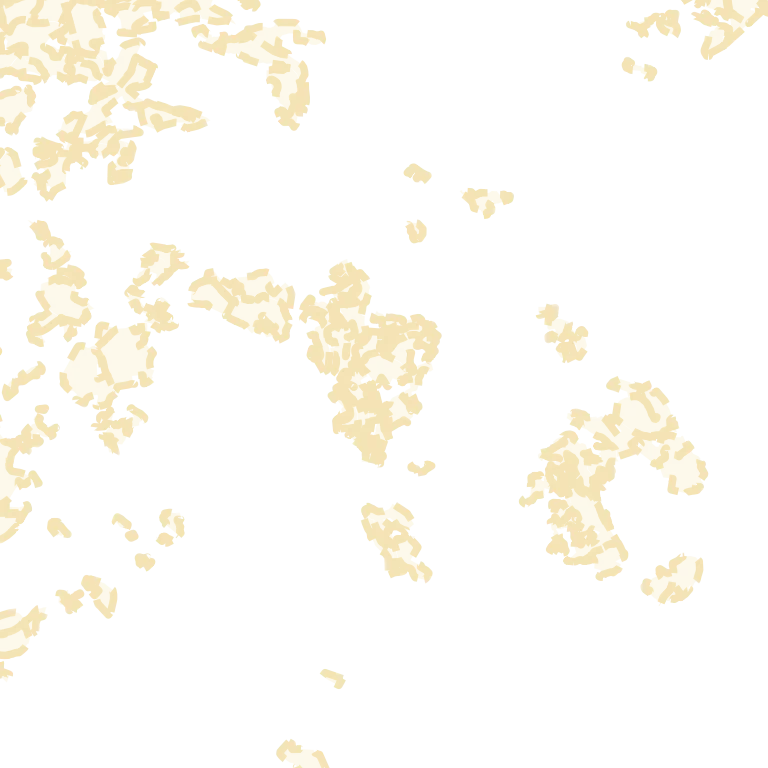
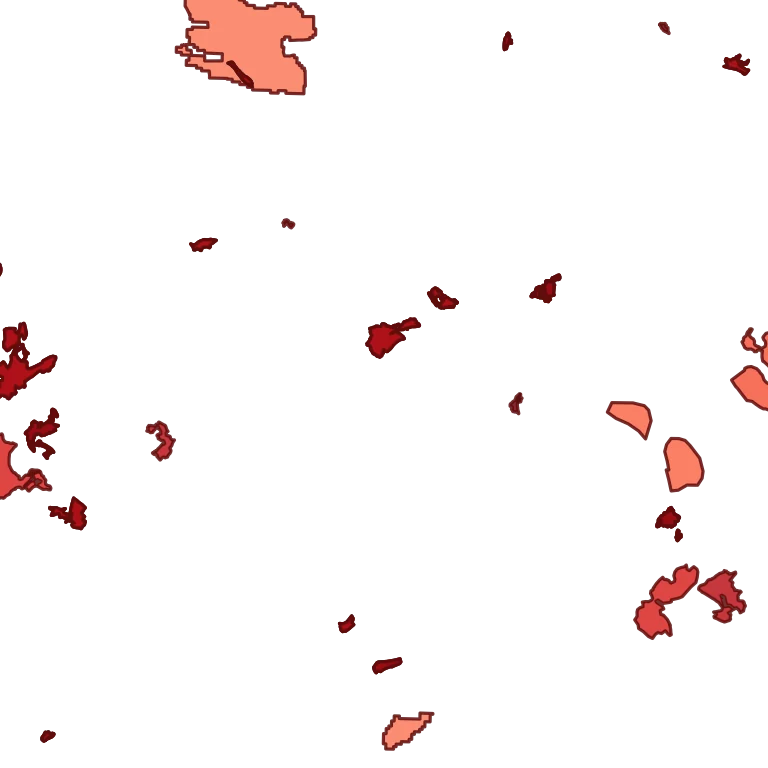
- Terrain Relief and contour lines of the area where the flock grazes.
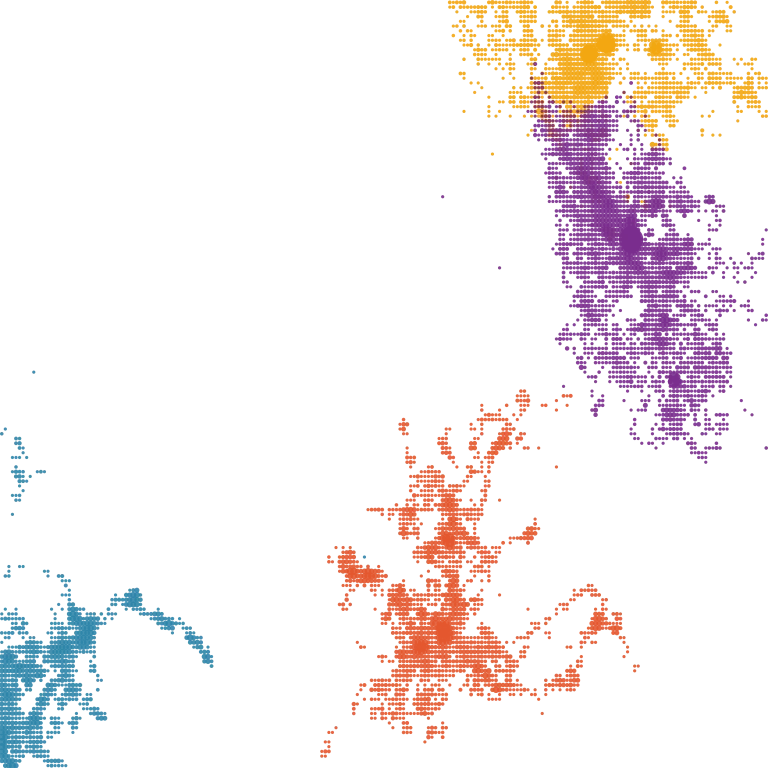
- GPS points Each collar's position through the day, with history and map playback.
- Routes Each flock's daily route, with grazing distances and times.
- Climate Temperature and rainfall over the period, read alongside grazing.
- COS and ISIP Land use and land cover crossed with grazing in the ISIP x COS matrix.
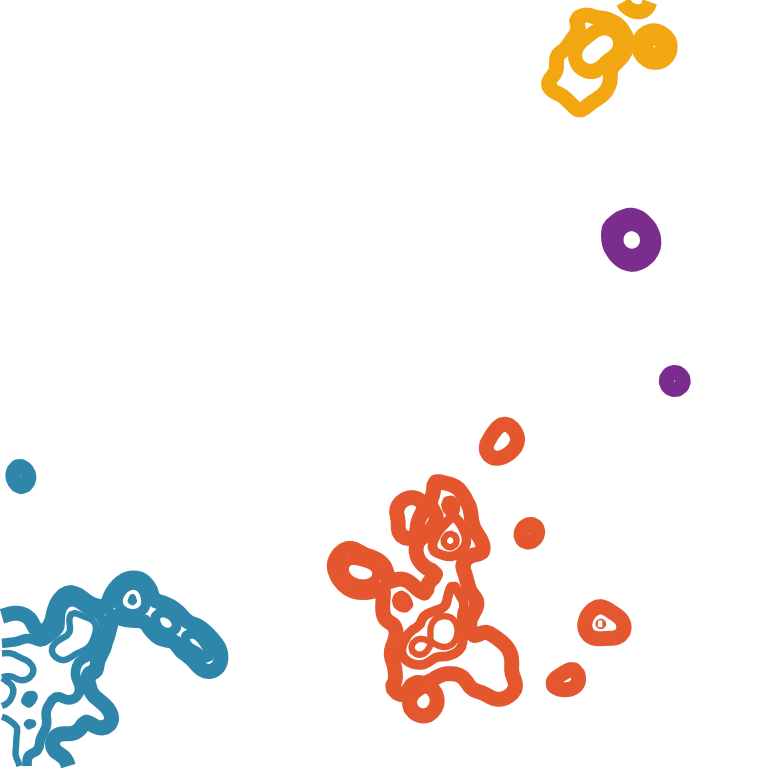
- Habitat Patches of natural habitats the flock moves through.
- Common land Boundaries of the community-owned land (baldios) where flocks graze.
- Burnt areas Wildfire history overlaid on the routes.
How it works
From the flock in the field to automated analysis, in six steps.
Collared flock
Each animal wears a GPS collar. The platform connects to Digitanimal and Domodis collars and also accepts positions imported from CSV.
The platform collects all the data
Positions reach the same server and draw each flock's tracks on the map.
We add the other analysis layers
Land cover (COS), burnt areas and historical data crossed with grazing.
Complete reports
Areas, distances and intensity per plot, in a PDF ready to share.
Chat with the agent
Plain-language questions about your flocks, answered with the platform's data.
Analysis automation with agents
Analyses and alerts that run on their own, as often as you choose.